How much Solar energy would we need to install to meet all of our energy needs? Solar does not have to meet all of our needs to make a meaningful impact, but it would be interesting to see what it would look like if it did.
There are a few simple calculations we can run to get a rough idea.
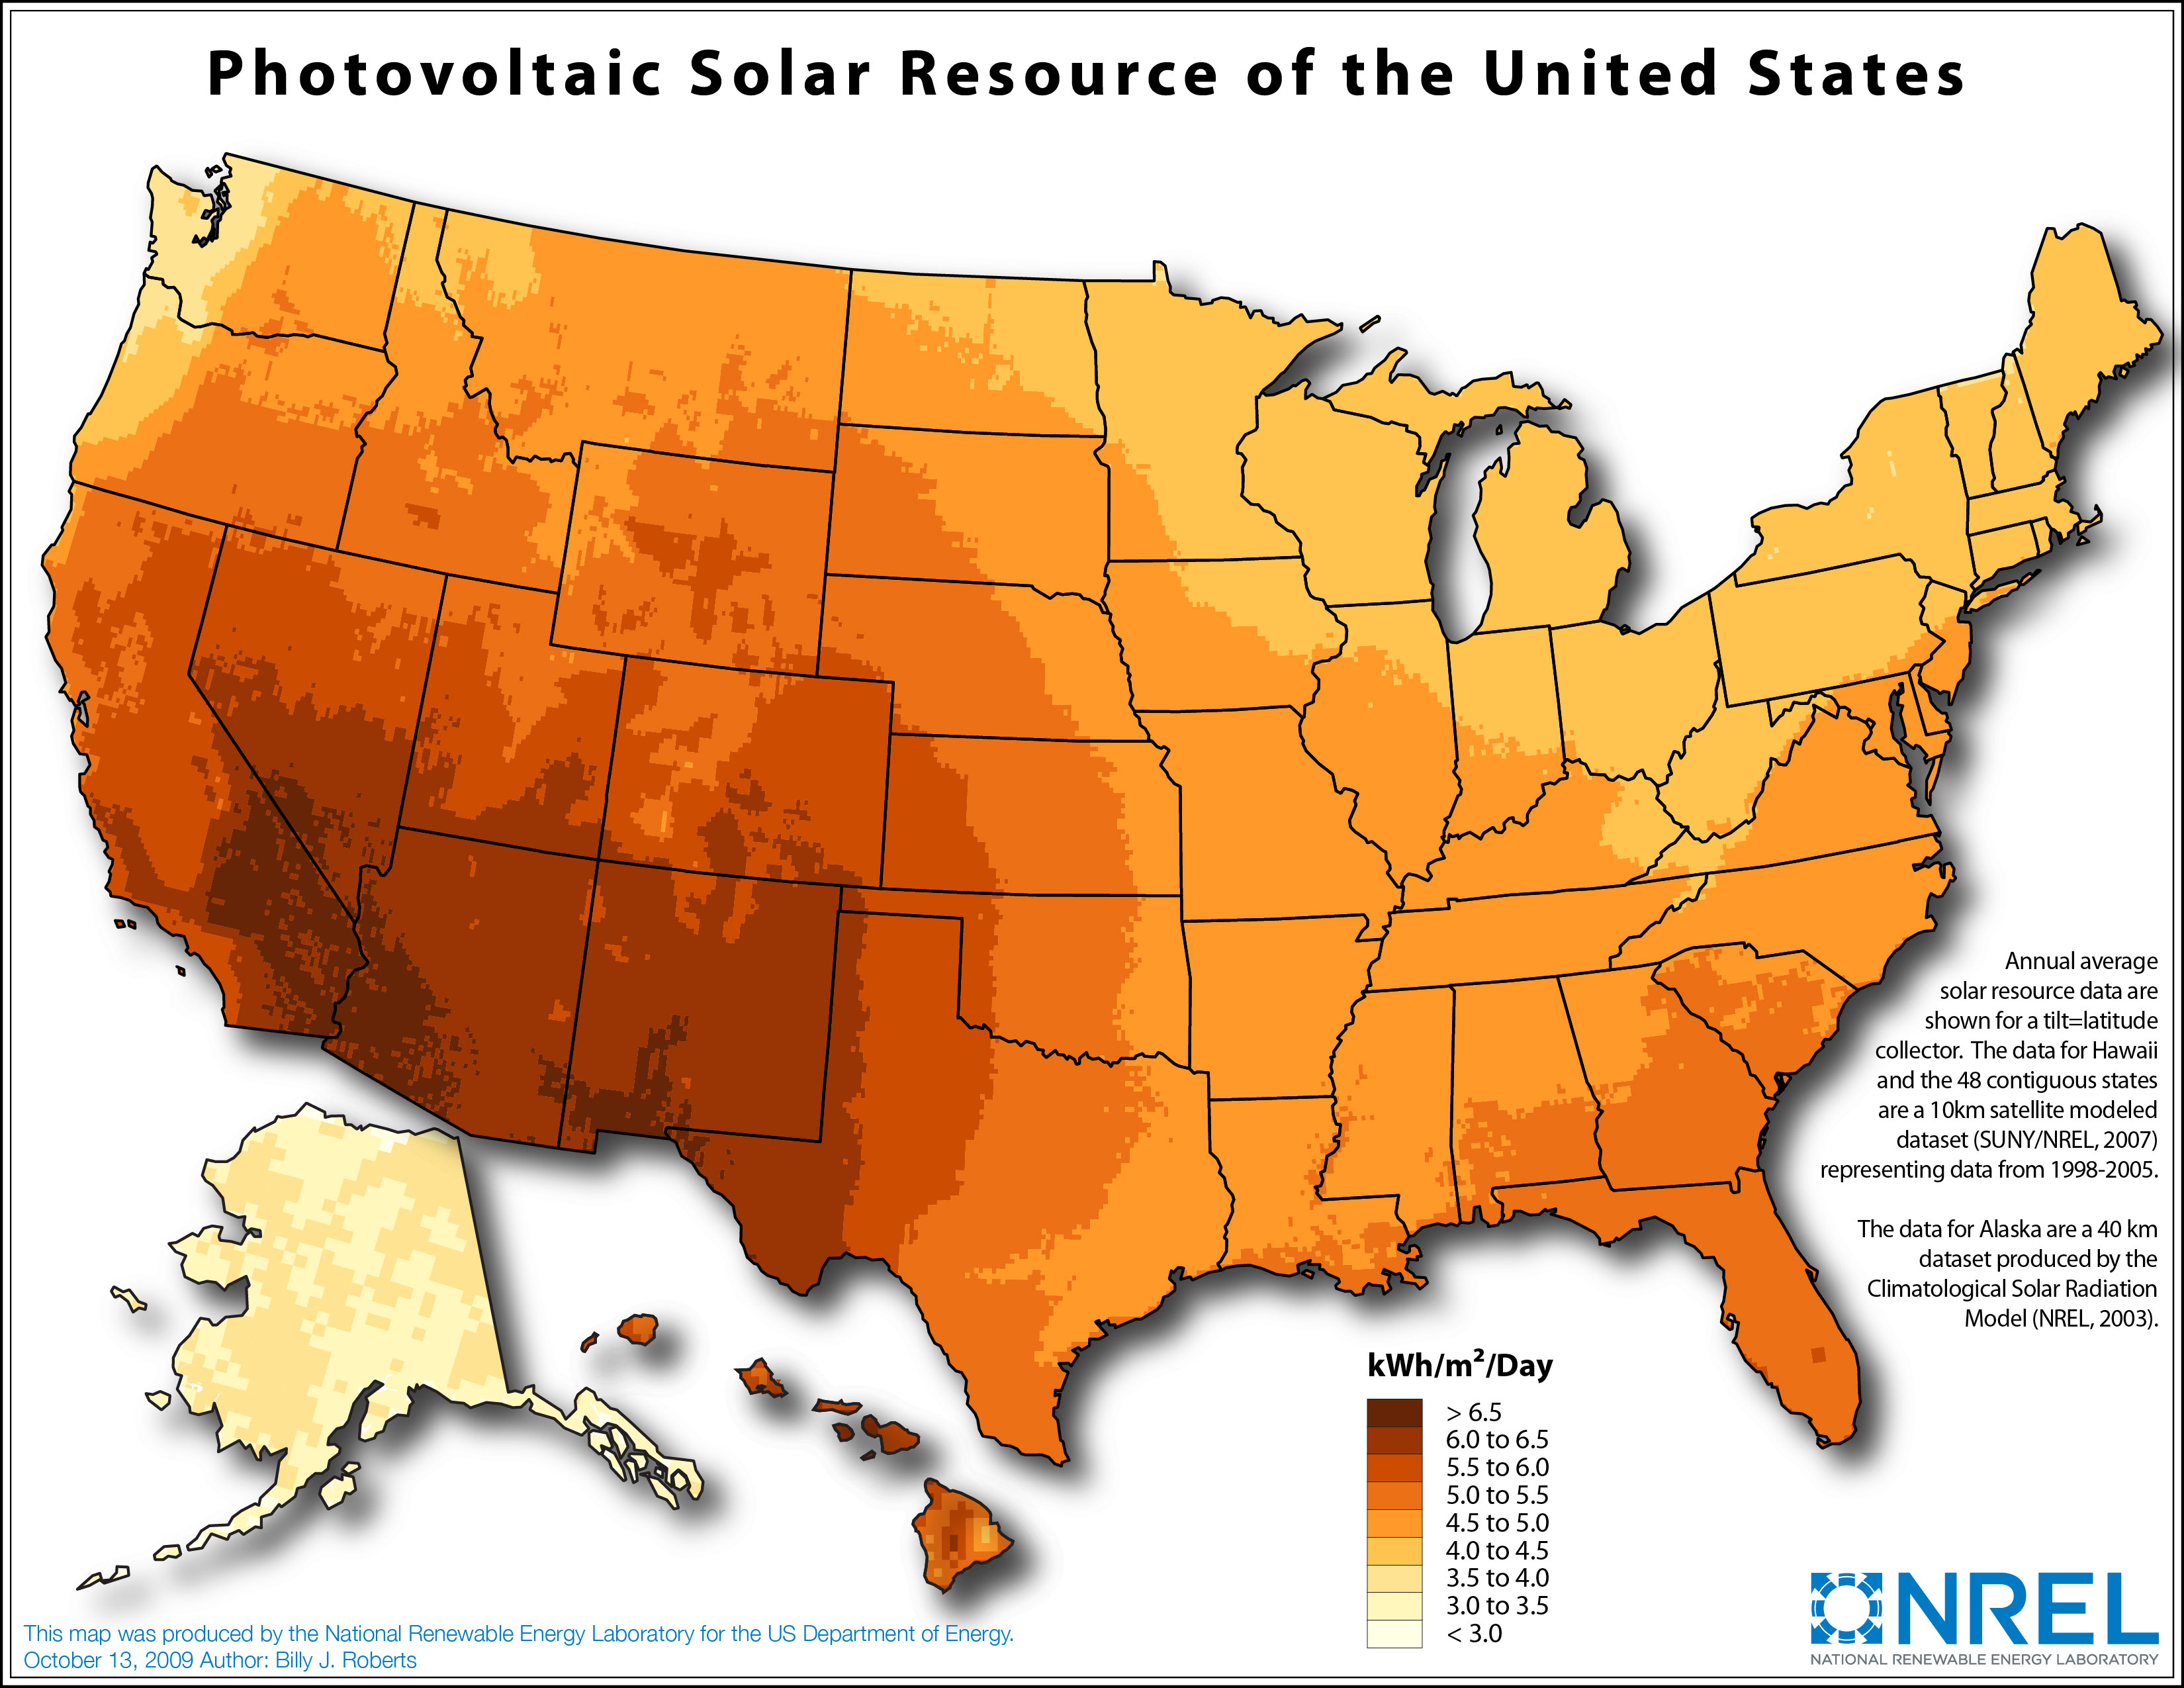
For the first two examples, we'll use the chart below from the NREL. It shows the Solar Resource for each region of the United States by kWh/m2/day. We'll use 6.0 kWh/m2/day for our calculations.
For the third examples, we'll use real kWh production numbers from Utility-Scale Solar (I could not find actual kWh generation numbers for Residential.).
Example 1: Total Annual Electricity Production
6 kWh/m2/day * 365 days = 2,190 kWh/m2/year
Solar PV will capture 15% of that annual 2,190 kWh resource.
.15 * 2,190 kWh/m2/year = 328.5 kWh/m2/year
Total Annual U.S. Electricity Generation: 4,092,935,000,000 kWh [2]
4,092,935,000,000 / 328.5 = 12,459,467,275 m2
12,459,467,275 m2 = 12,459.5 km2
Example 2: Total Annual Energy Consumption
6 kWh/m2/day * 365 days = 2,190 kWh/m2/year
Solar PV will capture 15% of that annual 2,190 kWh resource.
.15 * 2,190 kWh/m2/year = 328.5 kWh/m2/year
Total Annual U.S. Energy Consumption: 98.46 Quadrillion Btu [3]
98.46 Quadrillion Btu = 28,855,777,569,157 kWh
28,855,777,569,157 / 328.5 = 87,841,027,607 m2
87,841,027,607 m2 = 87,841 km2
The above examples have some assumptions. We are assuming the Solar Resource data is accurate. We are assuming the 15% efficiency rate. We are assuming the PV panels are laid back-to-back over thousands of square km's when in fact there would be space between them.
We have the actual kWh electricity generation numbers and actual square km information from some of the top Solar Utility-Scale installations in the U.S. (Note: These numbers are from the Wikipedia section for each Plant, so numbers may not be precise.):
| Top Utility-Scale Solar Installations in the U.S.[4] | |||||
|---|---|---|---|---|---|
| PV | T | T | T | T | T |
| Plant | Tech | Capacity | Generation (MWh)/Year | Area (km2) | Location |
| Solar Star I | PV | 579 MW | 896,830 | 13 | Rosamond, CA |
| Solar Star II | T | T | 809,157 | T | T |
| Desert Sunlight I | CdTe | 550 MW | 766,381 | 16 | Riverside, CA |
| Desert Sunlight II | T | T | 699,881 | T | T |
| Desert Sunlight III | T | T | 1,466,262 | T | T |
| Topaz | CdTe | 550 MW | 1,053,373 | 25 | San Luis Obispo, CA |
| CA Valley Solar Ranch | PV | 250 MW | 684,403 | 8 | San Luis Obispo, CA |
| Agua Caliente | CdTe | 250 MW | 741,181 | 10 | Yuma, AZ |
| Antelope Valley Solar | PV | 266 MW | 623,000 | 8.5 | Lancaster, CA |
| Mesquite Solar 1 | PV | 150 MW | 350,000 | 3.6 | Arlington, AZ |
| Copper Mtn I | PV | 458 MW | 100,000 | 5.7 | Boulder City, CA |
| Copper Mtn II | T | T | 224,986 | T | T |
| Copper Mtn III | T | T | 400,000 | T | T |
| Campo Verde | CdTe | 139 MW | 371,297 | 5.7 | Imperial County, CA |
| Centinela | ? | 170 MW | 550,000 | 8.4 | El Centro, CA |
| Solar Thermal (CSP) | T | T | T | T | T |
| Plant | Tech | Capacity | Generation (MWh)/Year | Area (km2) | Location |
| Ivanpah | CSP (Tower) | 377 MW | 500,000 | 16 | East Mojave Desert |
| SEGS | CSP (Trough) | 394 MW | 662,000 | 6.5 | Mojave Desert |
| Mojave | CSP (Trough) | 280 MW | 617,000 | 7 | Mojave Desert |
| Solana | CSP (Trough) | 280 MW | 944,000 | 7.8 | Gila Bend, AZ |
| Genesis | CSP (Trough) | 280 MW | 580,000 | 7.8 | Mojave Desert |
| Martin | CSP (Trough) | 75 MW | 155,000 | 2 | Indianatown, FL |
| Nevada One | CSP (Trough) | 75 MW | 136,000 | 1.6 | Boulder City, NV |
| Top Utility-Scale PV Averages | ||
|---|---|---|
| Plant | Generation (MWh)/Year | Area (km2) |
| Solar Star | 1,705,987 | 13 |
| Desert Sunlight | 2,932,524 | 16 |
| Topaz | 1,053,373 | 25 |
| CA Valley Solar Ranch | 684,403 | 8 |
| Agua Caliente | 741,181 | 10 |
| Antelope Valley Solar | 623,000 | 8.5 |
| Mesquite Solar 1 | 350,000 | 3.6 |
| Copper Mtn | 724,986 | 5.7 |
| Campo Verde | 371,297 | 5.7 |
| Centinela | 550,000 | 8.4 |
| Total: | 9,736,751 | 103.9 |
| Average: | 973,675 | 10.39 |
The average Utility-Scale PV plant is producing 1,000,000 MWh/year, or 1,000,000,000 kWh, in about a 10 km2 footprint.
Example 3: Total Annual Energy Consumption - All Utility-Scale PV
Total U.S. Energy Consumption: 28,855,777,569,157 kWh/Year.
Average Utility-Scale Solar plant produces 1,000,000,000 kWh/Year.
28,855,777,569,157 / 1,000,000,000 = 28,856
We would need roughly 29,000 Utility-Scale Solar plants to meet our total energy needs.
The average Utility-Scale Solar plant is 10 km2.
28,856 * 10 km2 = 288,560 km2
To get some perspective on the size of our 3 Examples, let's look at two recognizable features of the United States: California (423,971 km2) and The Great Lakes (244,160 km2). [5]
Example 1 -Total Annual Electricity Production: 2.9% of California or a little smaller than Lake Ontario (18,960 km2).
Example 2 -Total Annual Energy Consumption: 20.7% of California or a little larger than Lake Superior (82,100 km2).
Example 3 -Total Annual Energy Consumption - All Utility-Scale PV: 68% of California or all of The Great Lakes (244,160 km2) + a 2nd Lake Michigan.

Some might say, no problem, we can spread Solar installations the size of The Great Lakes around the United States.
Let's take a closer look.
Most experts say the best place for large-scale Solar development is the SW United States.
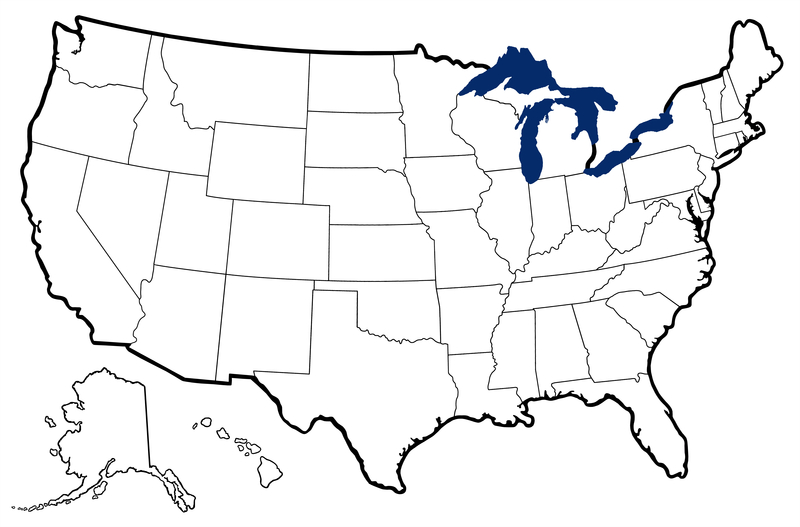
We can perform a simple visual experiment. Stare at the blue Great Lakes in the chart above for 5 seconds. Then move this mental image over to the area on the map of Southern California, Southern Nevada, Arizona, Utah, Colorado, and New Mexico. Are we really prepared to install solar panels across this entire region?
The question is do we really have the space? When you look at a map, it looks easy, but when you consider what already exists on the ground, space is actually limited. We have a big discrepancy in the km2 numbers between Example 2 and Example 3, but even installing Solar plants equivalent to 20% the size of California is not realistic.
Let's look at another example.
As we've seen CA is 423,971 km2. However, roughly half of this land is off limits.
Water: 20,031 km2
Sierra Nevada: 63,118 km2
Agriculture: 103,600 km2
Urban: 12,950 km2
Total: 199,699 km2
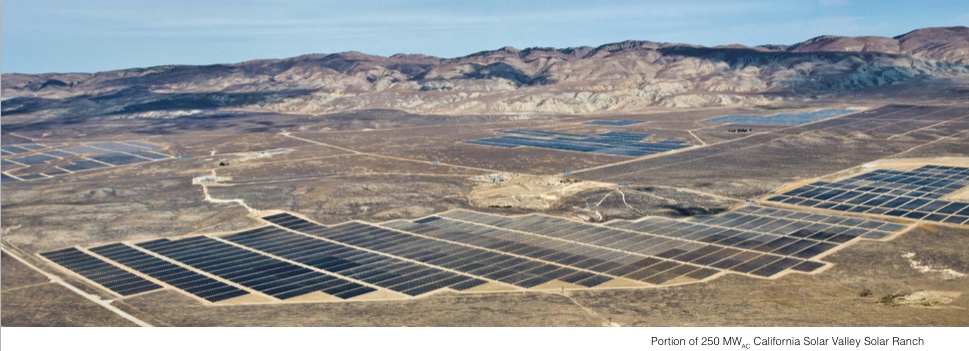
The picture below of the California Valley Solar Ranch in San Luis Obispo, CA gives us a feel for the size of a typical PV Plant.

Nevada, Arizona, Utah, Colorado, and New Mexico do have a lot wide-open space. However, much of this land contains mountains and beautiful valleys in between those mountains. Do we want to fill in the space with Solar plants?
It is not just the question of space. We'd need to build a lot of Utility-Scale Solar plants . . . . 29,000 of them.
To put it in perspective, here are the numbers for the existing power plants that provide for most of our energy needs today: [7]
Natural Gas: 1,725
Coal: 518
Nuclear: 63
Hydroelectric: 1,435
Petroleum: 1,101
Other Renewable: 2,299
Rooftop Solar
Today Solar is divided about 50 / 50 between Rooftop Solar and Utility-Scale Solar.
In Examples 2 and 3, we assumed we were using all Utility-Scale to meet our energy needs. In reality, we'd probably have some percentage as Rooftop and some percentage as Utility-Scale. It would likely be a higher % of Utility-Scale in order to scale faster. I searched for total Rooftop Resource, but I was unable to get the figures. If I can in the future, I will update this section.
It is also true that Solar does not have to account for all of our energy needs to have a meaningful impact. However, if Solar can not provide for our energy needs, we'll have to fill the void with other sources, and today most of those sources emit CO2.
In summary, it would be possible to install enough Solar energy to meet all of our energy needs, but it is going to consume more land than I believe any of us have really considered, and at the end of the day, more land than most of us will be willing to lose (especially environmentalists who have thankfully fought to preserve the limited remaining open space).
Enough of my predictions, next we'll take a look at the official predictions.

