One of the first things to understand in Solar economics is Swanson's Law.
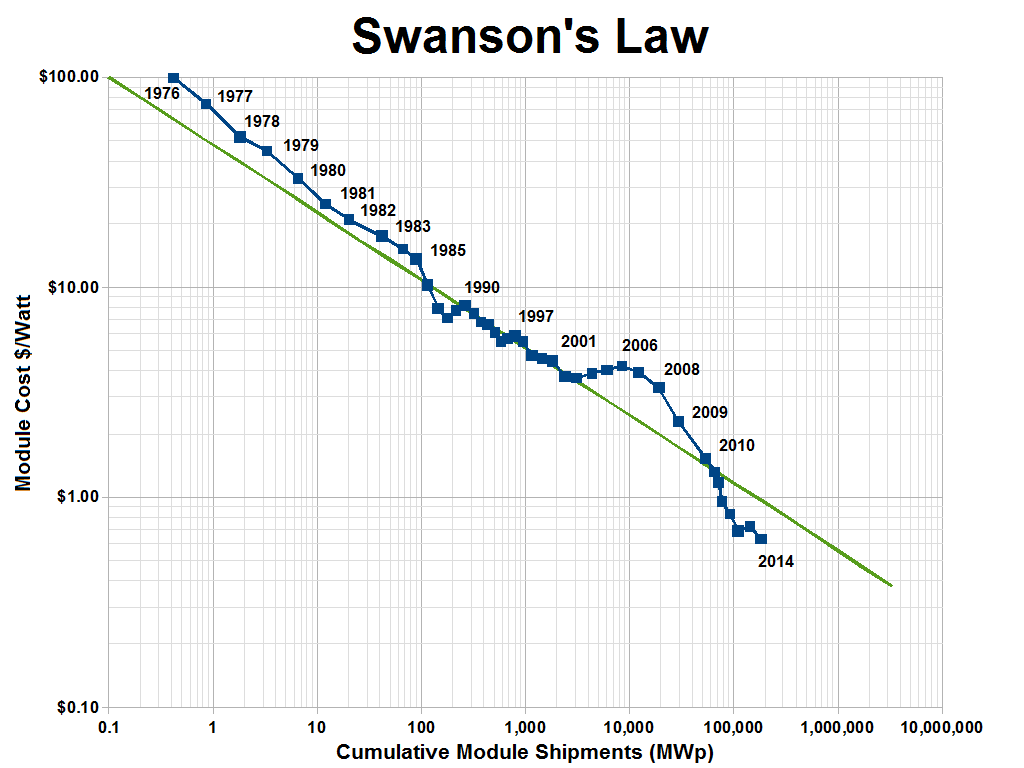
Swanson's Law [1]

SunPower Founder Richard Swanson coined the law, and it states,
Price of solar photovoltaic modules tends to drop 20 percent for every doubling of cumulative shipped volume.
Crystalline silicon photovoltaic cell prices have fallen from $76.67 per watt in 1977 to $0.36 per Watt in 2014.
Install Cost
Install Cost includes all the costs of installing a Solar system, including PV cost (largest portion), the inverter plus other components, and installation costs. The Solar industry uses a $/Watt ratio to measure Total Install Cost. For instance:
$3.3/W install cost * 4kW system ( 3.3 * 4,000 ) = $13,200
The $3.3/W cost multiplied by the size of the system installed (4kW), gives us the total cost of the system.
Retail Price of Electricity
The final piece of the puzzle is the Retail Price of Electricity. This is the price that you, as the solar homeowner, will either save because you are generating your own electricity, or you will sell when you are sending electricity to the Grid (Exported
Price). Either way, the Retail Price will determine the Payback Time of your Solar investment.
Solar Cost Example
Let's look at a typical Residential Solar installation to see how Solar energy is doing in terms of covering electricity needs and payback time.
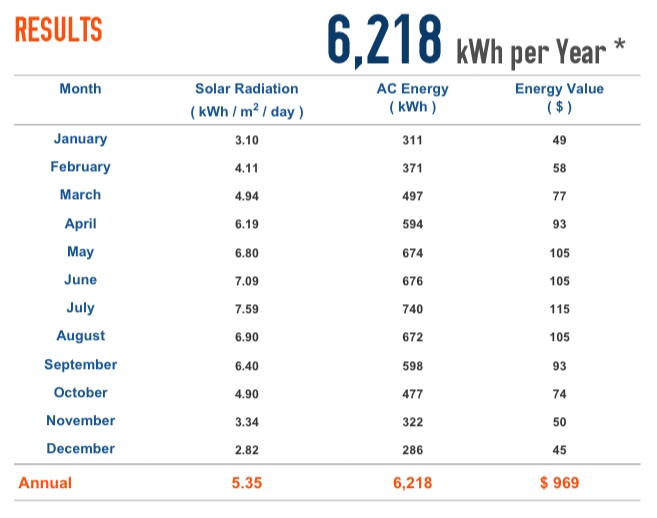
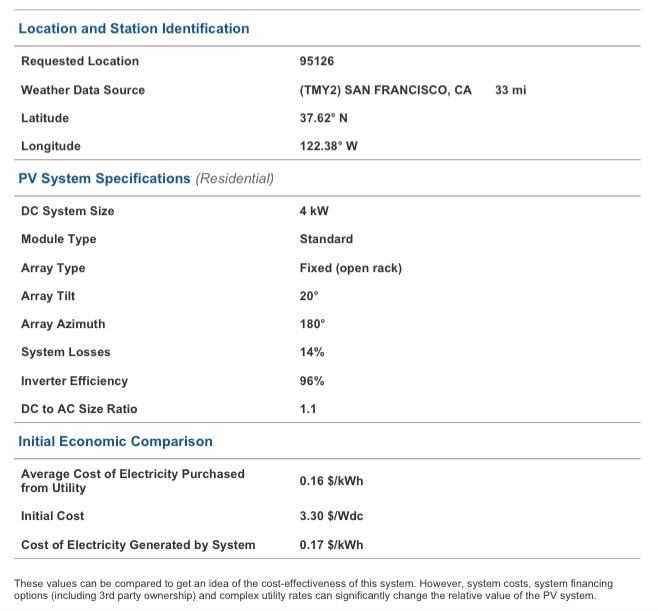
The National Renewable Energy Lab (NREL) offers a Solar calculator called the PV Watts Calculator. All you need to do is enter a zip code, and I used the zip code for a house in San Jose, California.


I've pulled the key numbers from the PV Watts Calculator into the chart below:
| PV Watts Calculator Results - San Jose, CA |
|---|
| 4 kW System (5 kW is U.S. average) |
| 25 Square Meters |
| 25 Year Warranty |
| Install Cost ($3.3W * 4,000): $13,200 |
| Annual Electricity Produced: 6,218 kWh |
| Annual Value of Electricity Produced (15 - 16 cent/kWh): $969 |
| Payback Time ($13,200 / $969): 13.6 Years |
| Profit (11.4 Years * $969): $11,045 |
Next, let's look at the typical electricity needs and costs for a U.S. home.
| Average Household Electricity Usage[2] | ||
|---|---|---|
| U.S. 2014 Average: | 911 kWh/Month | 10,932 kWh/Year |
| CA 2014 Average: | 562 kWh/Month | 6,744 kWh/Year |
| Average Household Electricity Bill[3] | ||
|---|---|---|
| U.S. 2014 Average: | $114.11/Month | $1,369/Year |
| CA 2014 Average: | $91.26/Month | $1,095/Year |
| Average Retail Electricity Price[4] | ||
|---|---|---|
| U.S. 2014 Average: | 12.52 cents/kWh | |
| CA 2014 Average: | 16.25 cents/kWh | |
I found that most $/Watt Install Cost Figures include the Investment Tax Credit. I called a licensed SunPower installer, and was told the gross
install costs are between $16,000 and $18,000 for a 4 kW system.
I found a range of $/W Install Costs in general. One reason for this could be that some costs use modeled
costs (i.e. what the cost should be if you add up all the module costs) and some use reported
costs. In summary, I found a range from the $3.3/W in PV Watts Calculator to the $4.5/W gross cost
to $5.34/W from California Solar Statistics.
Here are the costs and payback times with and without the ITC:
| With and Without ITC | ||||
|---|---|---|---|---|
| T | Generated Value | Costs | Payback | Profit |
| With ITC: | $969 | $13,200 | 13.6 Years | $11,045 |
| Without ITC: | $969 | $18,000 | 18.6 Years | $6,201 |
Our example tells us that the typical Solar installation in San Jose, California covers almost all of its electricity needs, pays itself off in just under 14 years, and nets a $11,045 profit over the lifetime of the installation (~ 3% annual return). Not bad.
We must note that California is a best-case scenario because it has more Solar resource, higher retail electricity rates, and lower electricity usage than the U.S. averages.
Utility-Scale Costs:
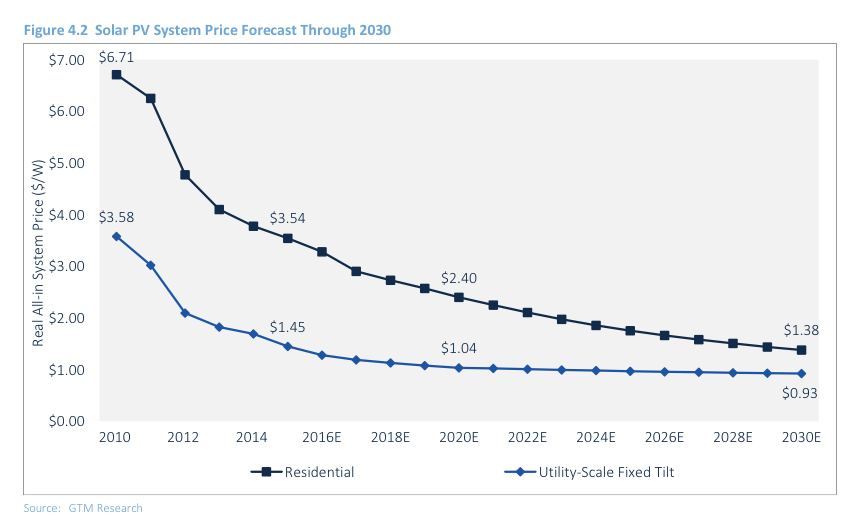
I am not going to attempt a Utility-Scale cost example, but the economics should not be too different from the residential example. Both are predominantly using PV, so the Solar efficiencies are similar. Utility does have lower install costs (as the chart below shows) due to scale. However, they might also have higher costs in other areas like clearing land and maintenance for example.

The economics look pretty good, and as the chart above shows, will continue to decrease as more solar cells are manufactured (20% Decrease for each Doubling). Costs will not decline forever though - note the flattening of the curves in Figure 4.2.
In our next section, we'll see that there is, however, just one more thing.