Solar energy growth took a sharp turn upwards starting in 2010.
Key factors behind the recent growth:
- Investment Tax Credit (ITC)
- Third Party Leasing and Net Energy Metering (NEM)
- State RESs, RPSs, and Incentives
- Utility-Scale Solar Comes Online
Investment Tax Credit (ITC) [1]
The Investment Tax Credit is a 30% federal credit on the gross cost of the solar installation and is valid for residential, commercial, and utility installations. It is a credit, as opposed to a deduction. A credit means you get to subtract the 30% directly off what you would have paid in taxes (unlike a deduction where you just reduce the gross income on which you are then taxed). A $20,000 solar installation receives a $6,000 credit, or $6,000 in your pocket.
The ITC was originated in 2006 and was set to expire in 2008, but in 2008 received an extension until 2016, which has provided market certainty for investors and encouraged long-term investments in solar.
Organizations such as the SEIA, a solar industry trade association, give credit to the extension of the ITC as a main reason for the recent uptick in solar, and warn that the expiration will lead to negative growth rates in 2017, the lowest level of solar install since 2012. (Note: The SEIA is paid by their solar membership to lobby for the solar industry.)
Third Party Leases and Net Energy Metering (NEM) [2]
The market certainty of the ITC has led to the growth of third party financing. The person or business that provides the capital for the solar installation receives the credit. Third party financiers can recoup 45% of their investment in tax benefits in year 1, and get an overall % return on their investment in the high single digits to mid-teens. The 3rd party financier profits and the homeowner reduces their electric bills from 20 - 50%.
Net Energy Metering is the ability to sell your solar power back to the Grid at retail prices. Today, most utilities (with the exception of Hawaii) agree to buy solar electricity from solar homeowners (also known as exported
electricity) at retail rates. The California Public Utilities Commission is in the process of reviewing the current rules, and it is expected that starting in 2016, California Utilities will buy exported
electricity at discounted rates. Significant changes in the price of exported
electricity could negatively effect the viability of third party financing.
Green Tech Media (a news and research organization dedicated to the next generation of electricity generation
) estimates that third party residential ownership went from 13% in 2009 to 41% in 2011 and accounted for 63% of California residential installation and 80% of Colorado installation in Q1 of 2012.
State Renewable Energy Standards (RESs) and Renewable Portfolio Standards (RPSs) [3]
The States are providing their own incentives to drive residential, commercial, and utility solar in order to meet specific renewable targets. A Renewable Energy Standard is a State saying, We will produce a certain amount of Renewable Energy as a percentage of our total energy needs by x date
, in an attempt to grow the slice of Renewable Energy in the Total Energy pie. A Renewable Portfolio Standard is a requirement a State places on its utilities to provide a certain percentage of their retail electricity from renewable sources.
California is leading the charge by a wide margin. To see what states are doing, let's take a closer look at California's goals.
California RESs (established in 2003):
- 33% by 2020
- 40% by 2024
- 45% by 2027
- 50% by 2030
In 2007, California set two initiatives to help achieve the RES goals. California established a goal to install 3,000 MW of Solar energy by 2016, and set aside a budget of $3.35B.
- New Solar Home, $400M and 400 MW
- CA Public Utilities Commission CA Solar Initiative (CSI), for $2B over 10 years and 1,940 MW by 2016 (for existing Residential and Commercial buildings)
A large portion of the dollars set aside in these budgets are financial incentives for homeowners, businesses, and utilities to install Solar energy. It is interesting to note, that all of these incentives have been exhausted.
The CSI program has installed 1,647 megawatts (MW), or 94 percent of its 1,750 MW goal, and will surpass its goal with another 258 MW waiting in pending projects.
In terms of the Renewable Portfolio Standards, the utilities seem to be on-track. According to the Q2 2015 California Renewable Portfolio Standard Quarterly Report, the three largest utilities reported that they collectively served 20.9% of their electric load with RPS-eligible generation during the 2011 - 2013 compliance period.
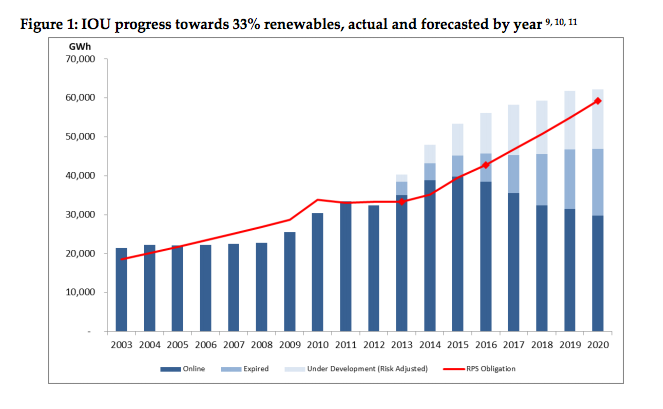
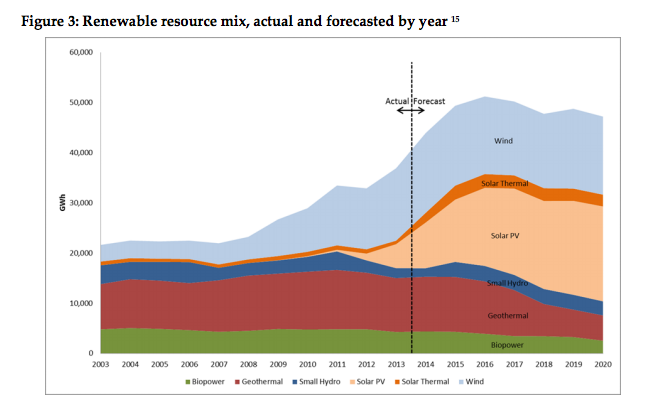
According to California Renewable Portfolio Standard Quarterly Report, Solar PV and solar thermal generating facilities are forecasted to contribute 40% and 5% respectively, of the state's total renewable generation by 2020.
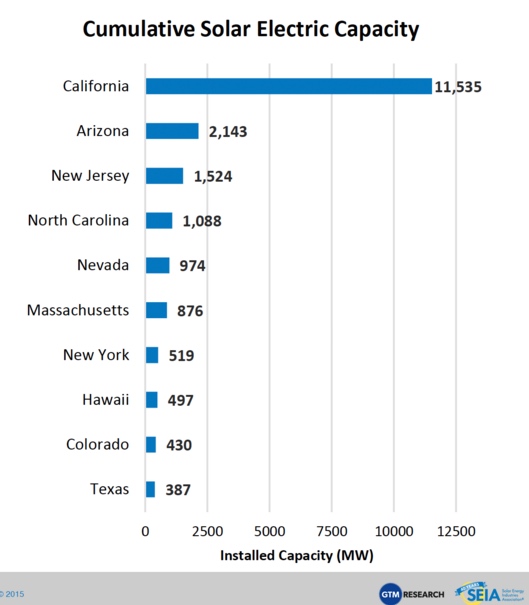
As we can see, California leads the nation in Solar energy by a long-shot, but other States recently active in encouraging Renewable and Solar energy are New Jersey, North Carolina, and Arizona.
Utility-Scale Solar [4]
The annual Utility-Scale Solar installation rate was always much less than the Residential and Commercial Solar installation rates until 2010, and then growth suddenly jumps.
It appears that the ITC plus dramatic support from the DOE Loan program have kick-started Utility-Scale Solar.
According the Department of Energy Loans Program Office, in 2009 there was not a single facility larger than 100 MW operating in the U.S.. Under a provision in the American Recovery and Reinvestment Act, the LPO provided $4.6 B in loan guarantees to support construction of the first five Utility-Scale PV solar facilities larger than 100 MW.
As of 2008, there was only 22 MW of PV utility installed. The LPO loans kicked off PV Utility-Scale as well as a renaissance for CSP.
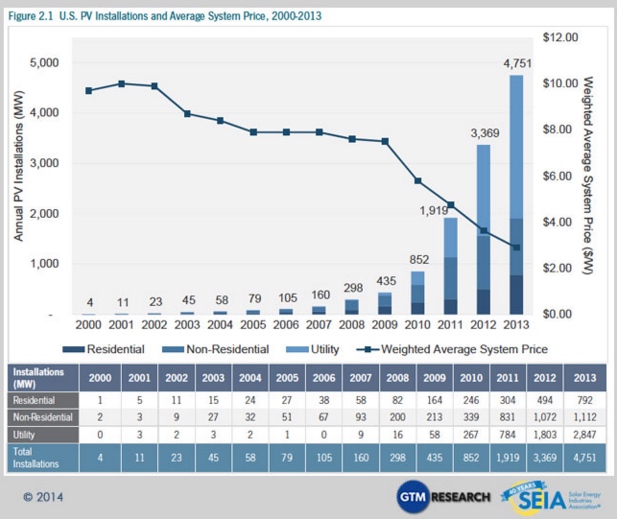
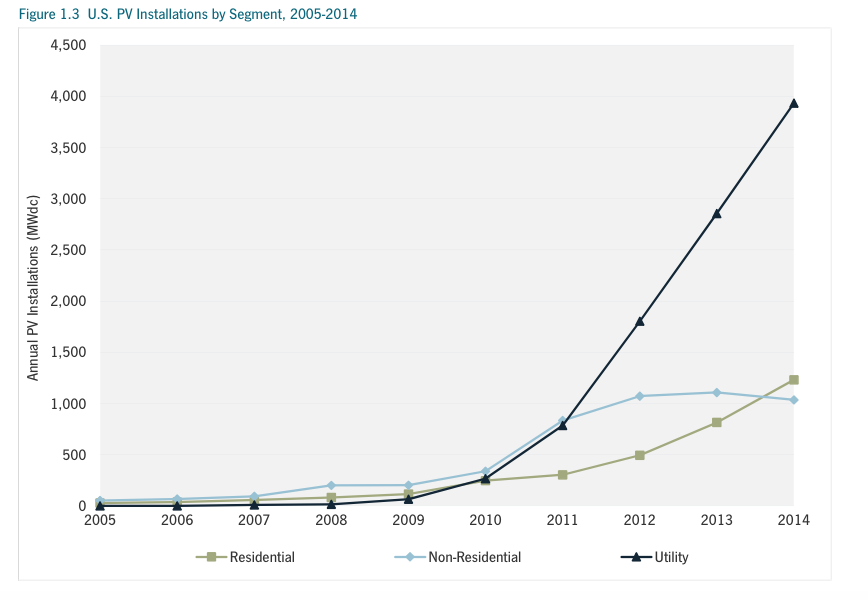
Notice that out of the 10,891 MW Solar installed from 2010 until 2013, 5,701 MW was Utility-Scale . . . or 52% of the total.
The biggest contributors to the dramatic uptick in Solar energy (starting in 2010) are California's Solar energy growth and the growth of Utility-Scale Solar, from virtually out of nowhere.
Solar energy costs have also continued to decrease over time, and have no-doubt contributed to recent growth. We'll take a closer look at this in the next section.